What is #BeatTheBenchmark?
#BeatTheBenchmark is a one-of-a-kind game coming to NARPM National this October!
The industry benchmarks for each of the below metrics (along with dozens of others) have been identified in the not-yet-released 2022 NARPM Benchmarks. These newly determined benchmarks will be released live at NARPM National Convention in Las Vegas on Thursday, October 21 … but from the open of the vendor hall on Tuesday until it closes Wednesday YOU can wager your guesses on what the new benchmarks will be at the 13 Metric Sponsor booths (and pick up as many more wager chips as you can at the Chip Sponsor booths), with a chance to win prizes worth over $500 from each Metric Sponsor, with a GRAND PRIZE of $3,000 CASH!
How do you play #BeatTheBenchmark?
All game play will take place onsite at the NARPM National Convention.
What am I wagering on?
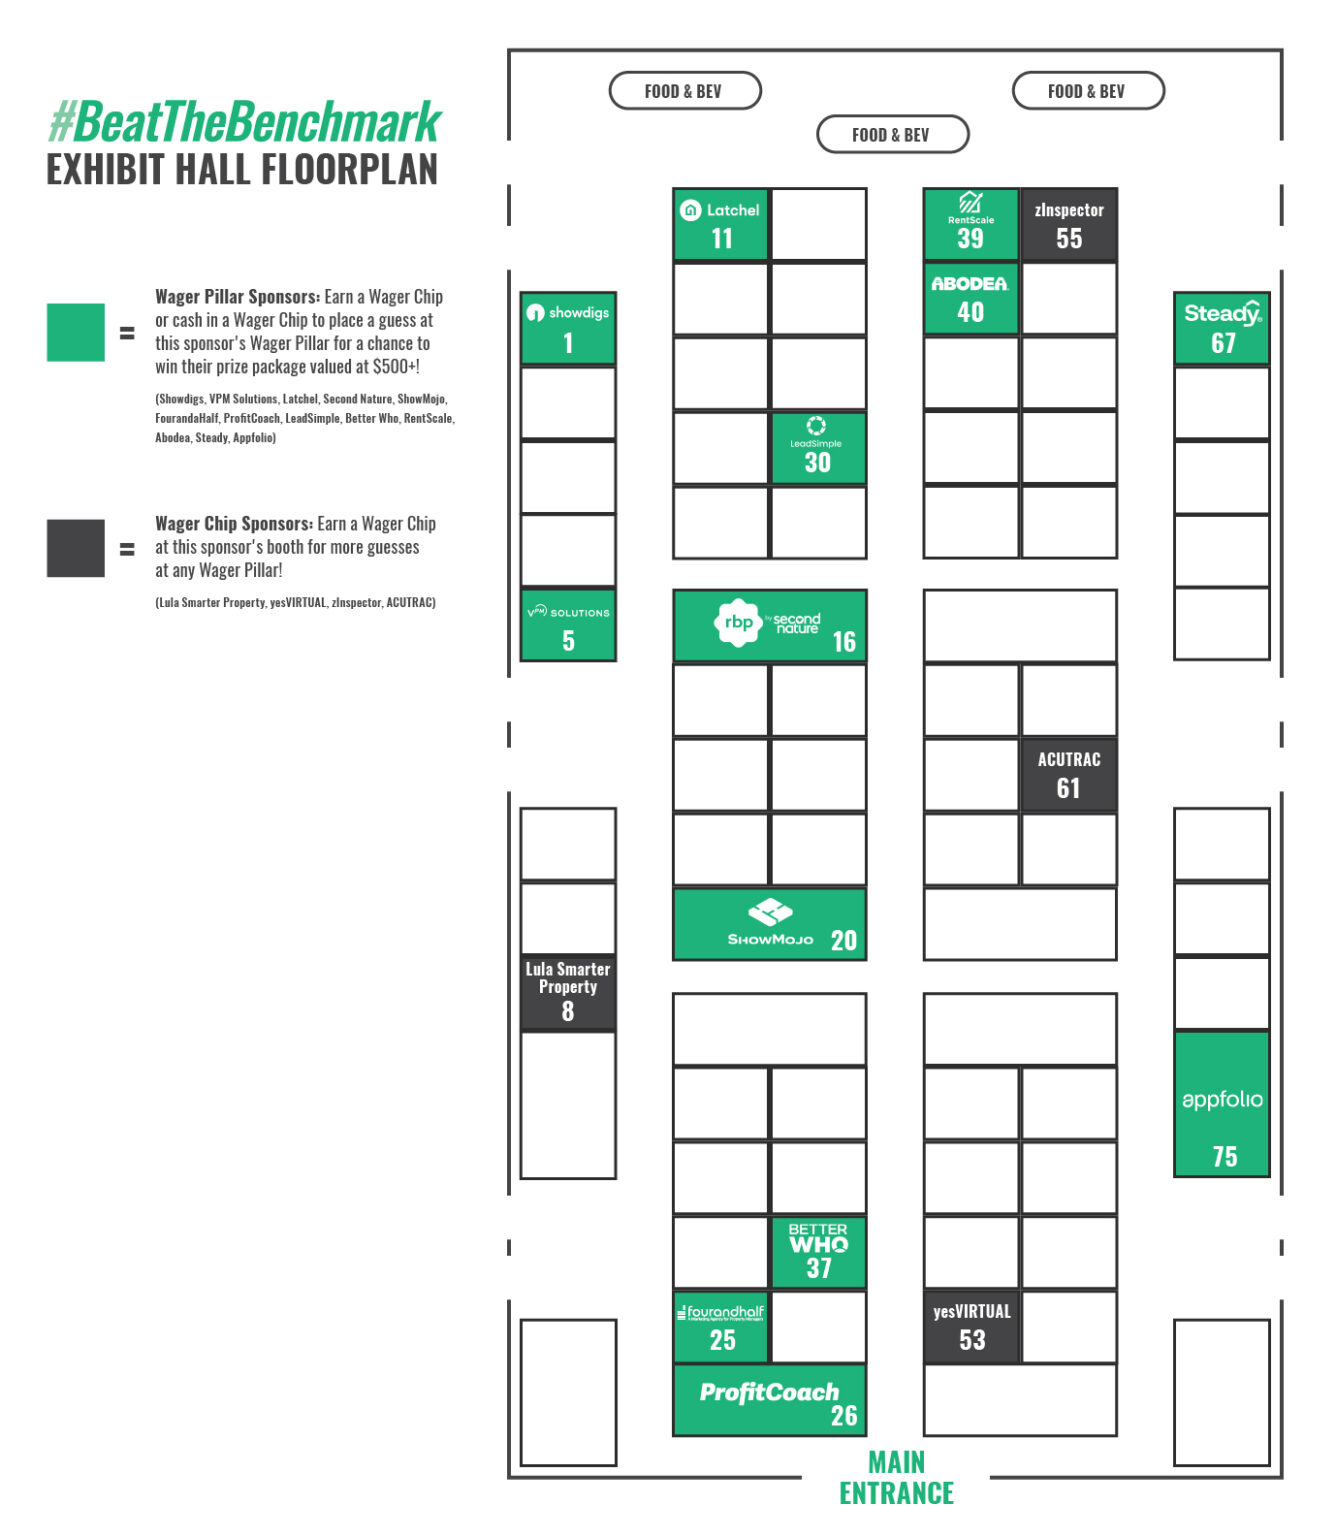
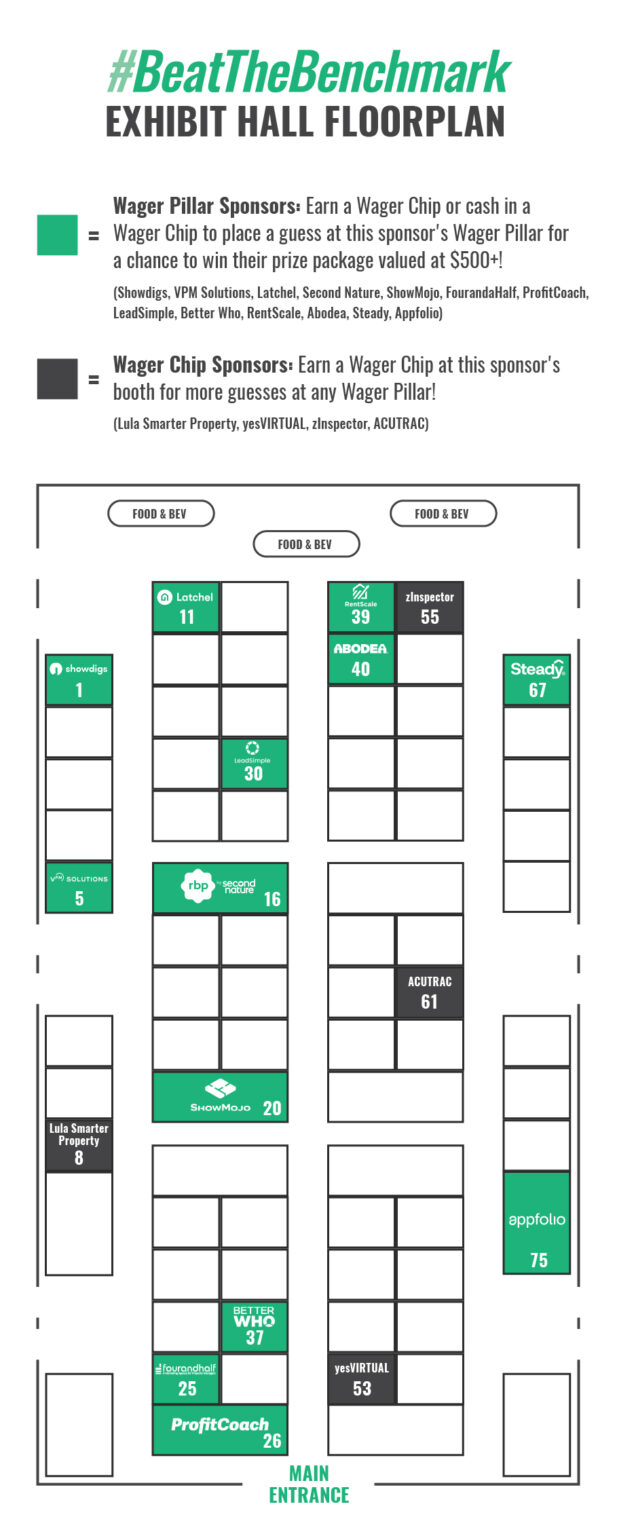
- Make your wagers on 13 different metrics that will be released in the 2022 NARPM Benchmark study! There will be 13 Wager Pillars throughout the vendor hall and Wager Chips available at 17 #BeatTheBenchmark participating vendors (see vendor map here). Play a Wager Chip at one of the 13 Wager Pillars to place a guess on what you think the new benchmark will be on the metric represented by that pillar. You can place as many guesses as you have Wager Chips on any (or all!) of the 13 Wager Pillars in the vendor hall!
How do I start playing?
- When you arrive at the Paris Las Vegas, you’ll receive a ticket for 2 FREE Wager Chips in your name badge at onsite registration on Monday.
- When the vendor hall opens on Tuesday at 4:30pm, redeem your ticket for 2 FREE Wager Chips at the ProfitCoach booth (booth #26, at the main entrance of the hall).
How do we win?
- You win on any of the 13 Wager Pillars by being the closest to the actual 2022 NARPM Benchmark number for the metric you guessed! Wagers close at the close of the vendor hall on Wednesday evening and winners will be announced during the Thursday morning general session, where the 2022 NARPM Benchmarks will be revealed LIVE!
What do we win?
- Each of the 13 Wager Pillar sponsors will be giving away a unique prize valued at $500 or more, with a GRAND PRIZE of $3,000 for the winner of the Profitability metric.
FAQ
Are those 2 Wager Chips all you get? NOPE! You can keep earning Wager Chips by:
- Visiting any of the Metric Sponsor OR Wager Chip Sponsor booths in the hall and telling them, “I want to #BeatTheBenchmark!” Each vendor will have a unique process for giving you more chips – it’s the game within the game!
- Make an online donation to the NARPM charity of choice, Make-A-Wish! For each $25 donation, you will receive one additional wager chip (to be picked up when you present your donation receipt at the ProfitCoach booth). NOTE: This will ONLY apply to donations made and validated during the run of the game on October 18 and 19, 2022.
Yes! There will be hundreds of spaces available on each Wager Pillar, and you can make as many guesses as you have Wager Chips! Just remember, once a space is claimed, it’s gone, so make your best guesses early!
Participating Vendors
More about the metrics
Profitability
What it means: The net operating profit associated with the property management division of your business.
Why it matters: Profitability gives a summary picture of the financial health of any company. Profit is the fuel that drives the entrepreneurial engine, the enabler of all the freedoms that motivate entrepreneurs to be in business for themselves: freedom of time, finance, relationships, and purpose
Unit Acquisition Cost
What it means: Unit Acquisition Cost establishes the total cost associated with acquiring a new unit, including sales and marketing labor expenses (for example, a Business Development Manager).
Why it matters: Unit Acquisition Cost demonstrates the efficiency of your sales and marketing efforts as a whole. It reflects the efficiency of your marketing campaigns (cost per lead) and sales labor (close rate). Ideally, UAC should be tracked for each lead source and should be closely monitored as you increase your investments in portfolio growth. UAC has a direct impact on Unit Lifetime Profit (ULTP) and should never exceed Unit Lifetime Profit before UAC (ULTP before UAC).

Profit Per Unit
What it means: Unit Acquisition Cost establishes the total cost associated with acquiring a new unit, including sales and marketing labor expenses (for example, a Business Development Manager).
Why it matters: Unit Acquisition Cost demonstrates the efficiency of your sales and marketing efforts as a whole. It reflects the efficiency of your marketing campaigns (cost per lead) and sales labor (close rate). Ideally, UAC should be tracked for each lead source and should be closely monitored as you increase your investments in portfolio growth. UAC has a direct impact on Unit Lifetime Profit (ULTP) and should never exceed Unit Lifetime Profit before UAC (ULTP before UAC).
Global Talent Utilization
What it means: Unit Acquisition Cost establishes the total cost associated with acquiring a new unit, including sales and marketing labor expenses (for example, a Business Development Manager).
Why it matters: Unit Acquisition Cost demonstrates the efficiency of your sales and marketing efforts as a whole. It reflects the efficiency of your marketing campaigns (cost per lead) and sales labor (close rate). Ideally, UAC should be tracked for each lead source and should be closely monitored as you increase your investments in portfolio growth. UAC has a direct impact on Unit Lifetime Profit (ULTP) and should never exceed Unit Lifetime Profit before UAC (ULTP before UAC).

Units Per Direct Team Member
What it is: This metric measures the average number of units under management per direct team member on staff.
Why it matters: This metric provides a tangible way of measuring the overall productivity of direct team members (team members who spend 50% or more of their time providing tenant or owner facing value).
Other Tenant Paid Fees Per Unit
What it means: A subset of Revenue Per Unit, Other Tenant Paid Fees/Unit measures monthly revenue per unit derived from tenant paid fees (not including Application fees).
Why it matters: Creating win/win value propositions for tenants has proven to be an important means of driving profitability for property management companies. Other Tenant Paid Fees/Unit provides a helpful target for understanding the revenue potential from tenant paid fees.

Unit Churn
What it means: Unit churn establishes the percentage of units which have exited your portfolio within a given time period. So a 2% monthly unit churn rate means that 2% of the units in your portfolio at the beginning of the month leave your business each month.
Why it matters: Unit churn has a direct impact on Unit Lifetime Revenue (ULTR). For example, cutting your churn rate in half (and thereby approximately doubling your ULTR) will have a disproportionate impact on Unit Lifetime Profit (ULTP) because of the initial acquisition and service cost associated with each new unit. Unit churn is a key factor in any recurring revenue business model and it is typically driven by customer satisfaction and movement in the real estate sales market. Segmenting your churn into good, neutral, and bad (see below) provides insight into the specific factors driving your churn below.
Unit Lifetime Revenue
What it means: Unit Lifetime Revenue establishes the average revenue contribution of each unit over the lifetime of the contract.
Why it matters: Unit Lifetime Revenue reflects the strength of your revenue model and customer retention. Understanding and optimizing the underlying factors that influence ULTR will lead to a stronger, more robust financial model and underlying business value. Specifically, ULTR demonstrates that you can grow revenue by expanding revenue per unit or by lengthening customer lifespans via decreased unit churn. This multidimensional view of revenue provides greater clarity than just the volume of units under management.
How to calculate: We calculate Unit Lifetime Revenue by dividing AUR by the annualized churn for the same twelvemonth period.

Revenue Per Unit
What it means: Revenue Per Unit establishes the revenue contribution of each individual unit under management each month.
Why it matters: Revenue Per Unit provides a bird’s-eye view into the financial health of your business as determined by how effectively your company generates revenue. When it comes to revenue growth, you can either increase RPU or acquire more customers. Both drive growth, but increasing RPU will also likely impact your profit per unit which means a greater financial reward for each door under management. RPU is a key lever in defining the strength and scalability of your business model. It is particularly useful to segment your portfolio by RPU to understand how each unit is contributing to the overall health of your portfolio.
Direct Labor Efficiency Ratio
What it means: The Direct Labor Efficiency Ratio measures the productivity of the subset of employees who spend 50% or more of their time providing client/customer-facing value to either owners or tenants. Specifically, PM DLER answers the question, “How many dollars of revenue do we generate for every dollar spent on direct labor?”
Why it matters: Direct Labor Efficiency Ratio is a productivity measure that measures the efficiency of the variable portion of your labor force. Segmenting the type of labor (direct vs management) allows for nuanced analysis of your labor force to understand which roles, employees, and types of clients are driving the greatest amount of revenue at the lowest cost—or vice versa. DLER typically falls within a band of 2.00 to 3.50, with a higher number providing greater financial performance. Fundamentally, this metric performs the function of holding direct labor accountable for driving revenue.
How to calculate: We calculate PM DLER by dividing the sum of PM Income by the sum of Direct Labor.

Total Labor Efficiency
What it means: Total Labor Efficiency is a measure of employee productivity. Specifically, PM TLER answers the question, “How many dollars of revenue do we generate for every dollar spent on labor?”. For example, a company with $4M in revenue and $2M in labor cost would have a TLER of 2.00. In other words, for every $1 in labor, the business receives a $2 return on that investment.
Why it matters: While Total Labor Efficiency Ratio is simply the inverse of labor spend as a % of revenue (revenue/labor instead of labor/revenue), it differs in that it is focused on driving revenue contribution (meaning, how much revenue did current labor produce). This simplifies forecasting and scenario planning by holding every labor dollar expenditure accountable to revenue output, either as an individual or a group. Lastly, because TLER is measuring efficiency in cost to revenue, as opposed to the number of people to units or people to revenue, it is flexible enough to factor in any kind of labor regardless of whether it’s full time, part time, contractor, or virtual.
How to calculate: We calculate PM TLER by dividing the sum of PM Income by the sum of Direct Labor and Management Labor.

Leasing Labor Efficiency
What it means: Leasing Labor Efficiency measures the productivity of leasing-focused team members and contractors. Specifically, this metric answers the question, “How many dollars of revenue do we generate for every dollar spent on leasing direct labor?”
Why it matters: Historically, many PMs have paid out 50% or more of their leasing revenue in commissions to agents . Now, more progressive companies are leveraging technology and global team members to aid in the leasing process and spend much less on leasing. This metric provides a way of measuring these efficiency gains.
Ancillary Revenue Per Unit
What it is: A subset of Revenue Per Unit, Ancillary Revenue Per Unit measures monthly revenue per unit derived from all fees outside of the base monthly management fee.
Why it matters: While there are a variety of successful approaches to pricing, perhaps the most successful approach is an “unbundled” approach in which a large portion of revenue is derived from fees beyond the base management fee. Ancillary Revenue Per Unit provides a helpful target for understanding the revenue potential from ancillary fees beyond the base management fee.
Coming to NARPM National this October:
#BEATTHEBENCHMARK
The PM Game you can't miss
Want to play? Sign up for the latest rules and insider tips. Let’s #BeatTheBenchmark!